Welcome to CyIPT, a research project funded by the UK Department for Transport.
 CyIPT is a collection of tools aiming to provide an evidence-base for prioritisation of transport infrastructure that will get more people cycling.
You have reached the development area, which is not publicly accessible.
For more information on CyIPT see the About page or the Manual
You can contact us by e-mail via the details on the Contacts page linked above.
CyIPT is a collection of tools aiming to provide an evidence-base for prioritisation of transport infrastructure that will get more people cycling.
You have reached the development area, which is not publicly accessible.
For more information on CyIPT see the About page or the Manual
You can contact us by e-mail via the details on the Contacts page linked above.
On its first run the CyIPT recommended 9,342 schemes in England, with an average cost of £730,000 and total cost of £6.8 Bn for an average length of 1.1 km and a total length of 10,600 km with an average benefit of £1,467,000 and total benefits of £13.7 Bn an average BCR of 14.
To trial CyIPT, please fill in the Access Form.
{$login}COVID-19 resources - new:
Rapid cycleway prioritisation tool
If you would like to gain access to results from CyIPT in response to emergency funds to reallocate space, please see our preliminary results that are based on data from the project. There you will find a link to a 5 minute survey. Please provide feedback on the results as it will help improve the results for the final release. |
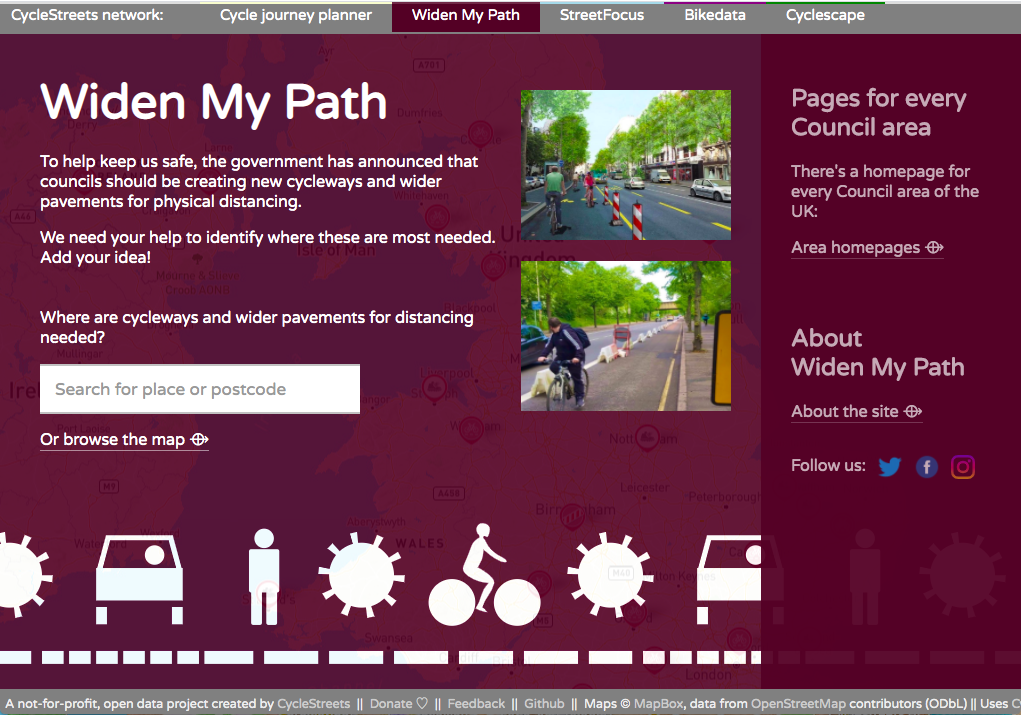
Widen My Path
Widen My Path, created by CycleStreets, enables anyone anywhere in the UK to suggest where more space is needed for physical (social) distancing. Councils and local groups can then use the resulting map and open data created by the site to inform where changes could be made. |
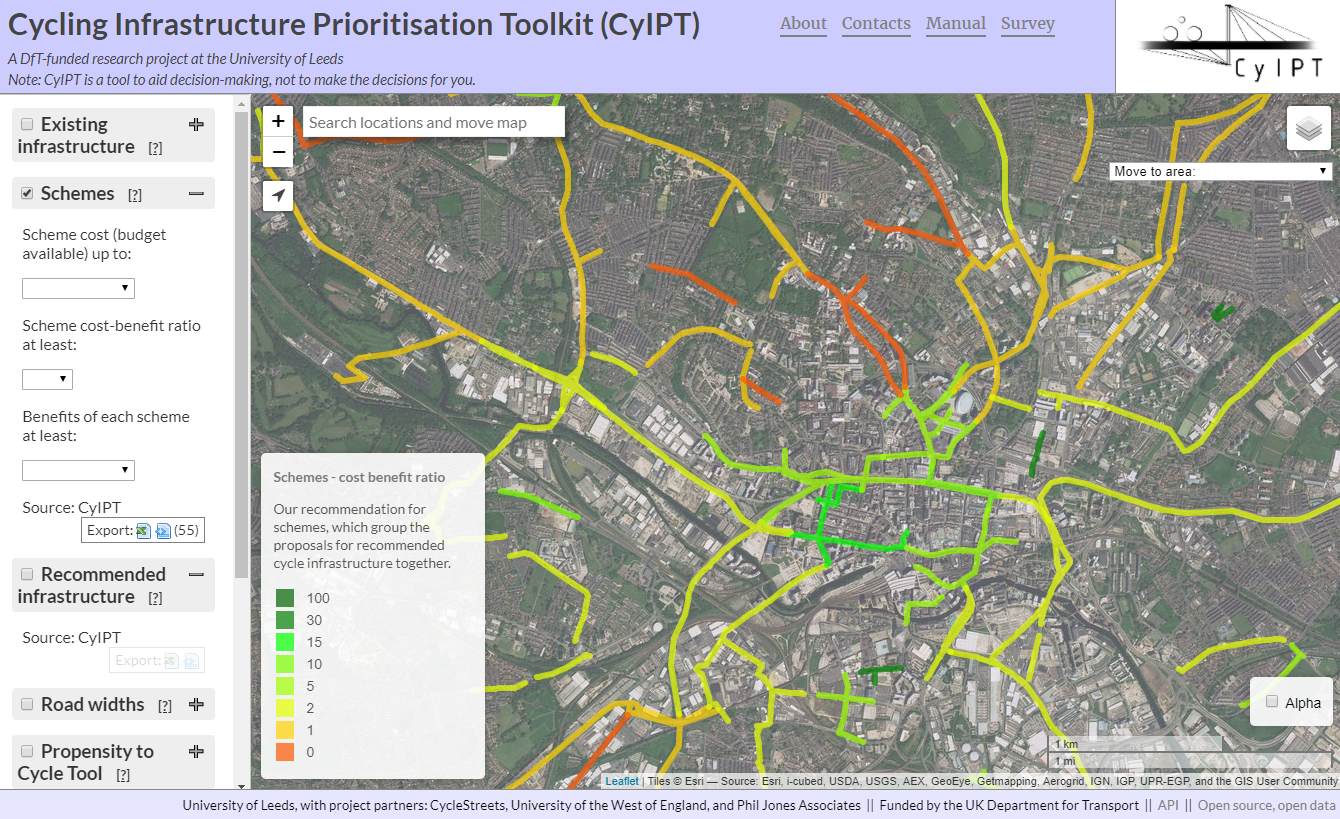
The Cycling Infrastructure Prioritisation Toolkit, is a prototype developed by the University of Leeds and funded by the Department of Transport. The purpose of the toolkit is to aid decision makers in finding the best places to put new cycle infrastructure.
CyIPT uses data about the existing road network, such as speed limits, road types and traffic levels combined with information about cycling levels to reccomend the most appropriate type of cycle infrastructure on each road in England.
CyIPT then attempts to group its recommendations into buildable schemes, and evaluate thoses schemes by estimating:
- Construction costs
- Increase in number of cyclists
- Benefits from increased cycling
- Benefit cost ratios
You can contact us by e-mail at info@cyipt.bike.
Please do fill out our survey to give us your thoughts on where we should concentrate further development.
Schemes
The Schemes layer is an aggregation of the recommended infrastructure layer. Recommendations are made at the road segment level (junction to junction), and therefore can be very short. Schemes groups recommended infrastructure together into schemes that could possibly be constructed, and then evaluates the scheme against a range of criteria. For further details see the relevant section of the CyIPT Manual.
Recommended infrastructure
This layer shows the type of cycle infrastructure appropriate on each road segment based on guidance from Highways England IAN 195/16. Interventions are recommended for each segment based the following criteria:
- Whether the route is on road or off road (e.g. paths)
- The speed limit
- The motor traffic level
- The number of cyclists using the road (based on PCT Census 2011 scenario)
Using this information CyIPT makes one of seven possible recommendations. Common infrastructure types are illustrated in the figures below:
- None
(Not shown) no specific cycling infrastructure is required.
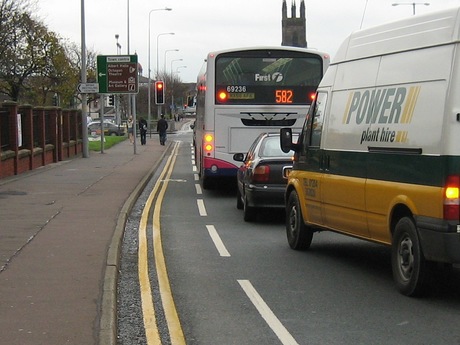
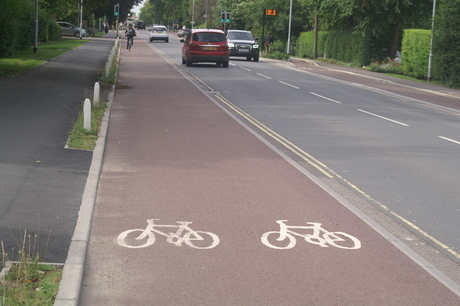
- Cycle Lanes
A painted line on the roadway divides bicycles from other traffic:
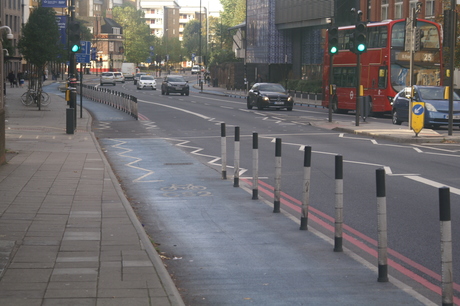
- Cycle Lanes with light segregation
Similar to cycle lanes but batons or armadillos are added long the line to reinforce the separation between cyclists and motor traffic:
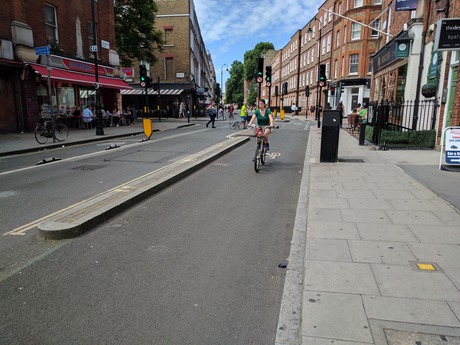
- Stepped Cycle Tracks
Cyclists travel on a slightly elevated lane, above the road traffic but below the pavement:
- Segregated Cycle Track
Cyclists travel in a separate lane physically separated from motor traffic by a hard barrier:
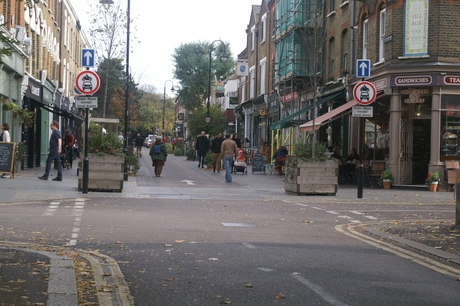
- Cycle Streets
These very quiet roads are primarily designed for cycling and walking while still allowing low speed motor traffic:
- Cycle Lane on Path
(Off Road Only) cyclists are separated from pedestrians by a painted line.
- Segregated Cycle Track on Path
(Off Road Only) cyclists are separated from pedestrians by a hard barrier.
For further details see the CyIPT Manual.
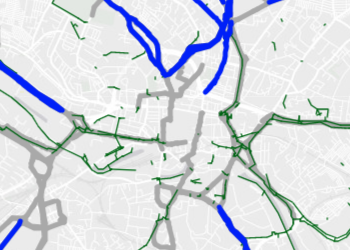
Existing infrastructure
The layer highlights existing cycling infrastructure. Unlike other cycle maps (e.g. OpenCycleMap) which include designated cycle routes, this map only shows physical infrastructure such as cycle lanes and tracks.
This data is derived from OpenStreetMap and then cleaned by CyIPT so may have inaccuracies. If you see an error, you can click on the road and use the 'Edit in OSM' link to modify OpenStreetMap. The modification will automatically be incorporated into CyIPT at the next rebuild.
The layer also gives the option to see the speed limit on each road. Again, this data is derived from OSM and a cleaning algorithm to fill in missing data.
For further information: see the CyIPT Manual
Road widths
The road width layer has two modes (road width, width status).
Road width
The road width layer shows and estimate of the road with based on the OSM. The calculation use standard lane widths and information on the number of lanes and footways to estimate the total width of the carriageway.
Width status
The width status layer compares the estimated width of the road with any proposed new cycling infrastructure to width of the road as measured from the Ordnance Survey MaterMap. This mode helps highlight locations where road space is limited and space reallocation may be required to provide new cycling infrastructure.
For further information: see the CyIPT Manual
Propensity to Cycle Tool
This layer shows data from the Propensity to Cycle Tool (www.pct.bike) which has been reanalysed by CyIPT. The PCT LSOA fastest routes have been matched to the road network to give total counts of cyclists on each road segment. This is similar to the PCT LSOA route network raster but provides a greater level of spatial detail.
This layer also allows you to view the straight lines, fastest routes, and quietest routes from the PCT LSOA dataset.
For further information: see the CyIPT Manual
Traffic counts
This layer show data from the DfT of traffic counts mapped to the road network. It is provided at context so show what CyIPT “sees.” Data is taken from the most recent year available on a road-by-road basis thus the data is not consistent.
For further information: see the CyIPT Manual
Collisions on road network
This layer uses the official STATS19 data on road collisions from 1985 to 2015. Collisions are viewable a points, or mapped on the road and junction network.
When CyIPT matches collisions to a specific road or junction, it considers whether the STATS19 data states the collision occurred at a junction or not. If the collision occurred at a junction, it is mapped to the nearest junction. Otherwise, the collision is mapped to the nearest road segment.
The STATS19 data has some ambiguity in the location of collisions; therefore it is possible that some collisions are mapped inaccurately to other nearby roads and junctions.
For further information: see the CyIPT Manual
Collisions at junctions
For further information: see the CyIPT Manual
Collisions as points
For further information: see the CyIPT Manual