3 Key concepts
3.1 Accuracy
While using CyIPT it is important to bear in mind that:
- It was funded under the Innovation Challenge Fund (ICF) and at present should be regarded as a proof of concept prototype demonstrating what is possible.
- As CyIPT is a national tool, it uses national datasets which may be less detailed and up-to-date, than local data sources.
- As CyIPT is a national tool, it has probably had limited human oversight in your area. Results have been ‘sanity checked’ for some areas but we are unable to check if every road in the country has sane results (please report on our issue tracker if not).
- CyIPT relies on the OpenStreetMap (OSM), the quality of which varies across the country.
- Currently the results are based on commuter cycling only, meaning other data sources and local knowledge must be used to account for other trip purposes (e.g. recreational cycling, travel to schools, shops). We hope to add travel to school and public transport links in due course.
- The results do not take account of the wider transport and political context.
While CyIPT provides detailed numbers such as costs and cycling uptake, it is best views as a tool to draw your attention to specific areas that may benefit from improved cycling infrastructure, rather than an automatic transport planner.
The layers in CyIPT are intended to provide insight into various geographic factors that should inform the decision-making process. For example the traffic counts layer has many roads without any traffic data. This does not mean there is no traffic on these roads. It simply means that CyIPT does not know about the traffic on these roads, and its recommendations will be affected by this lack of knowledge.
Users should evaluate each recommendation independently, scrutinising how CyIPT came to its conclusion and validating those assumptions.
3.2 Open Street Map
CyIPT uses the Open Street Map (https://www.openstreetmap.org/#map=6/54.910/-3.432) to provide the base road and path map of England. CyIPT uses OSM for several reasons: OSM’s open licence allows free use and reuse of all the data; National coverage; OSM has more detail about cycling infrastructure than some official sources.
However OSM has several limitations, firstly as a crowd sourced dataset the accuracy and detail of OSM is variable. While OSM covers over 99% of the roads in the UK, details such as rad types, speed limits, cycle infrastructure, etc. are far patchier. CyIPT has a built in OSM cleaner that attempts to remove errors and fill in missing data. For example, CyIPT will assume that the speed limit on a residential road is 30 mph unless otherwise specified.
CyIPT users can improve CyIPT results in their area by updating OSM. The Existing Infrastructure Layer (see below) has a “Edit OSM” button that links directly from any road in CyIPT to the same road in OSM. Updates to OSM are incorporated into CyIPT when the next national rebuild occurs.
3.3 Cycling Flows from the PCT
CyIPT Uses the Propensity to Cycle Tool (PCT www.pct.bike) to provide data on the existing and future cycling flows on each road. This data is in turn taken from the 2011 census commuting flow data. Therefore:
- CyIPT is biased towards commuter cycling due to using the PCT data.
- CyIPT has a 2011 view of travel patterns but for existing travel and as a baseline for predicting future demand.
National cycling and travel trends have not changed significantly between 2011 and the present day, however, in local areas travel patterns have changed due to new cycle infrastructure and new housing. Users should apply extra scrutiny to CyIPT results in areas where there have been significant changes since 2011.
3.4 Rate Limiting
To maintain the performance of the CyIPT website, the map data is rate limited. These limits will prevent you from downloading too much data at once. You are most likely to encounter rate limiting when attempting to view large areas. When rate limiting occurs, the data will appear on the map in a patchy or random fashion, as illustrated in Figure 3.1.
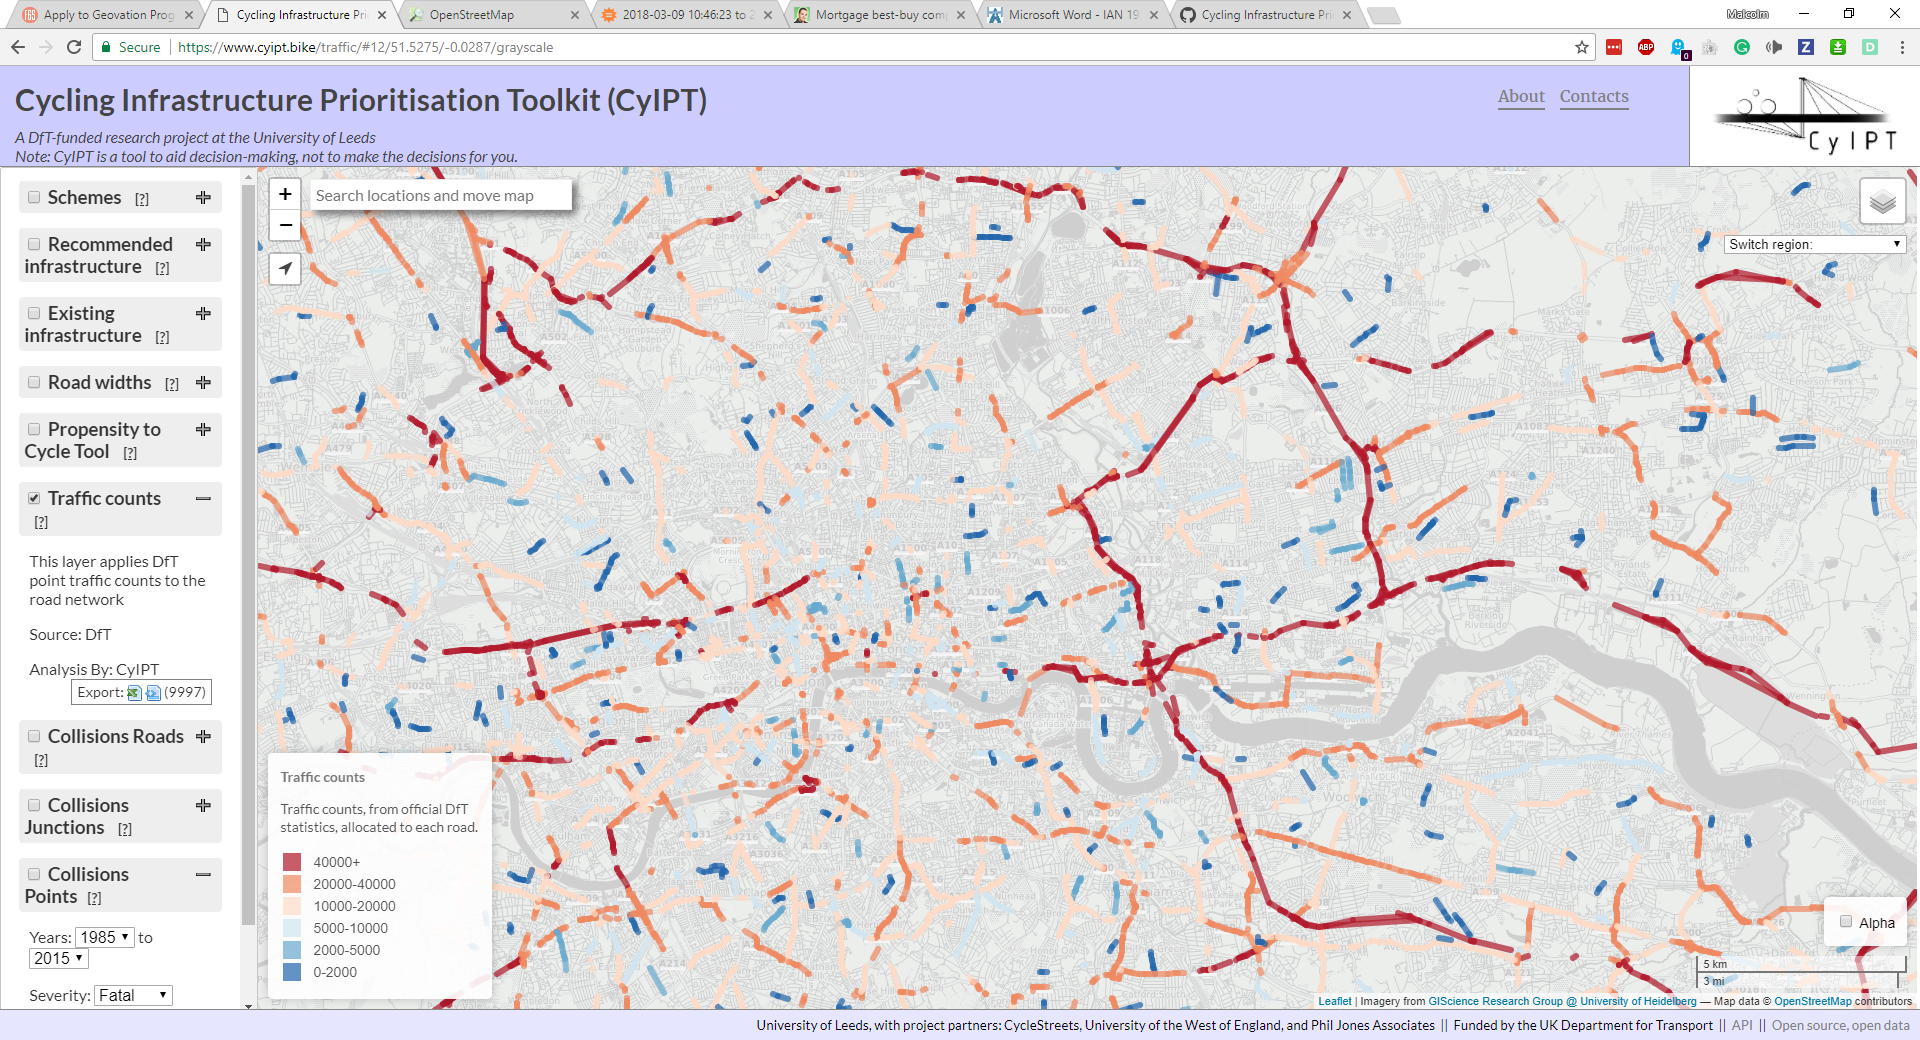
Figure 3.1: Example of the map of London when rate limited is in effect.
For some layers now data will show until you are zoomed in to a certain level. While some layers (e.g. Propensity to Cycle Tool layer) provide more detail the further you zoom in.
3.5 Geometry Simplification
To allow you to view the results of CyIPT over larger areas, the CyIPT website simplifies the geometry of the roads when zoomed out. This simplification can be noticeable when zooming, resulting in curved lines becoming straight. The simplification process is performed after the analysis has been completed, and therefore does not affect the results.
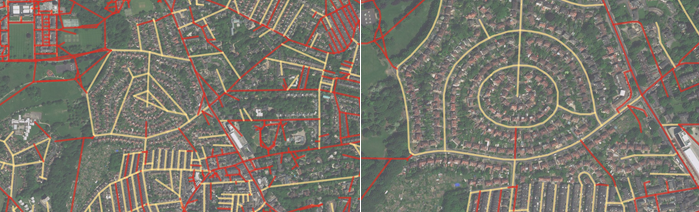
Figure 3.2: Example of geometric simplification when zoomed out (left) and full detail when zoomed in (right).